On December 21, the MMD Research Institute published the results of the survey on the actual use of smartphones, "2021 Edition: Smartphone User Survey Survey".
The next graph is to hear the smartphone usage time for 2,173 men and women aged 15 to 59, who own smartphones."2 hours or more and less than 3 hours" is the most 19th.7 %, hereinafter "1 hour or more and less than 2 hours" 16.3 %, "3 hours or more and less than 4 hours" 16.Following 1 %, these three items are more than half of the total 52.Occupies 1 %.
According to the 2020 survey, "2 hours or more to 3 hours" 19.2 %, "3 hours or more and less than 4 hours" 16.6 %, "1 hour or more and less than 2 hours" 16.It is 3 %, and the total of 3 items is the same 52 as this year..1 %.It seems that there was no significant change in the ratio of the volume zone.
On the other hand, "less than 30 minutes" is 2.7 % → 4.9 %, "less than 1 hour or more" is 6.3 % → 8.The percentage of 3 %, which is less than an hour, is increasing.Five.The answer to "10 hours or more" was 9 % 4.It has fallen to 3 %, and as a whole, smartphone use time tends to decrease.Compared to 2020, when the time spent at home was long due to Corona's evil, 2021, when the infection has improved, it may have reduced the time to go to smartphones due to work, academic or other outings.
When asked about the number of transmitted times per day about each carrier mail / message / LINE, the carrier mail / SMS is "0 times" 68.2 % / 61.While it was 3 % and 60 % or more, LINE's "0 times" 18.Only 7 %, "1-10 times" 57.8 %.All answers other than "0 times" are overwhelmingly LINE, and it seems that LINE is no longer the case that the commonly used communication tools are LINE.

By the way, in comparison with last year, each "0 times" is 5 carrier emails..3 points increase, SMS is 3.1 point increased, LINE is 2.It has increased by 6 points, and more people have no chance to use any tools.This seems to be an increase in face -to -face communication opportunities due to the improvement of the corona situation.
But that's not the only reason.The next graph shows the transition from 2018 about the number of transmits of each tool from 2018, but LINE has reduced the number of transmissions through this during this time, and carrier mail and SMS are not noticeable but decreased.There is.It may be something like communication fatigue.
The next graph was asked to Instagram users if Instagram had purchased a product.
The total 38 answered that they had experience.It was 0 %, but there was a clear difference between men and women.Women are in their teens and 30s and over 50 % have purchased, while men are at most 30s in their 30s..Only 3%.46 women in total age.1 %, 23 for men.5 % was a double score with experience.
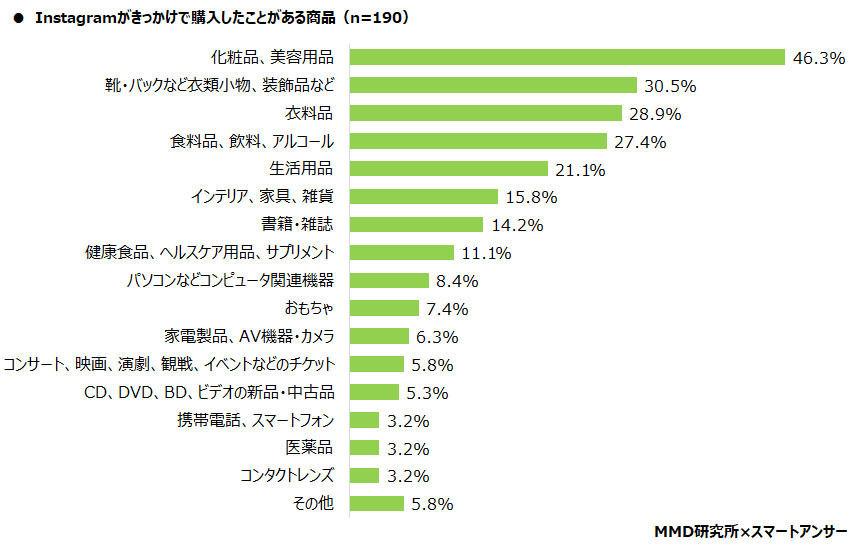
The products purchased on Instagram are also reflected, and cosmetics / beauty products are the top, followed by clothing accessories, ornaments, and clothing such as shoes / bags.
This year, we have been asking about digital gifts, which are increasing in recent years.First, the next graph was asked about the cognitive and usage status of digital gifts.24 people who have used it.5 %, about one in four.Overall 33.2 %, almost one in three answers, "I don't know at all," and "I've heard but I don't know well.".Along with 9 %, about half of them do not know what digital gift is.It is difficult to say that it is still recognized.
Of those who have used digital gifts, we have received 79.9 %, I have sent 53.1 %.There are surprisingly few people who have just received it and have just sent it.The products that I have received are "Points Gift Code", "Drink Food", and "Convenience Store Products", and the products I have sent are "drink food" "Points" "Points".It was the order of "gift code" and "convenience store product".
A joint survey was conducted at Smart Answer, Internet Research Service for smartphones provided by Folium Co., Ltd.